- Howie Fenton
- |
- May 22, 2017
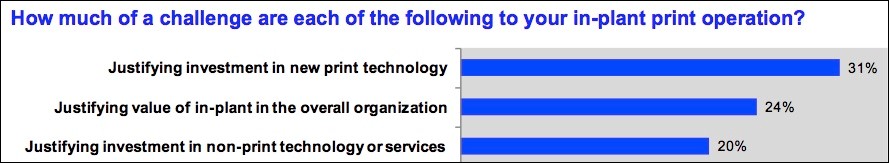
In the recent PRIMIR study entitled "Digital Printing Technology's Influence on the U.S. In-Plant Printing Market" that IMG worked on with IDC, we identified that the top in-plant challenges focused on justifying:
- Investments in new print technology
- The value of the in-plant, and
- Investing in non-print technology or services.
I will discuss steps in my next three blogs that you can take that will form a strategy to help overcome justification issues. There are three steps in all-- measure performance, benchmark performance and build a "Battle Book" of justifications. This post will focus on measuring performance.
Good and Bad Measurements
Performance data and benchmarking are the best tools to address justification, especially when your in-plant comes under attack by outsourcers or facilities management firms that claim they can do the work more productively and at a lower cost. Solid, quantifiable performance— and the measurement of that performance— helps you counter those attacks.
Every in-plant has different data they track and use. Usually it focuses on operational concerns such as volumes and schedules. Understanding your in-plant’s products, run lengths, specifications and volumes is a good first step but understand that this is not actionable data.
Often the data collected and reported is not actionable data. For example, page count is one of the most frequent measurements reported to administration. While an indication of how busy you are, page counts are not actionable. One way to determine if data is actionable is to ask, "What could I change if this data (page counts) increased or decreased?" By definition, actionable data means you make a change and determine if that change helped or hurt production.
School District Measures SLA's
A school district in California has begun using turnaround time as the actionable data that they report. When we first consulted with them a few years ago, their turnaround time was six weeks, which was considered too long. After they followed our recommendations about staffing and adding a Web to print solution (RSA's WebCRD), their turnaround times shrank to four weeks. Over the next two years as demand increased, their turnaround times grew to six weeks and they knew that action was required.
The point is not the specific recommendations but the actionable data measurement. In this situation turnaround times or SLAs (service level agreements) were the perfect actionable data because it tied directly to customer satisfaction. Interviews with customers helped us understand that a six week SLA was unacceptable, four weeks was acceptable, and three weeks was the ultimate goal. Once they reduced SLAs from six weeks to four weeks, they continued to monitor SLAs. When it returned to six weeks again, they knew it was time to take action.
In my next blog post I'll discuss how benchmarking performance is another step of your strategy to overcome justification issues.